Overview
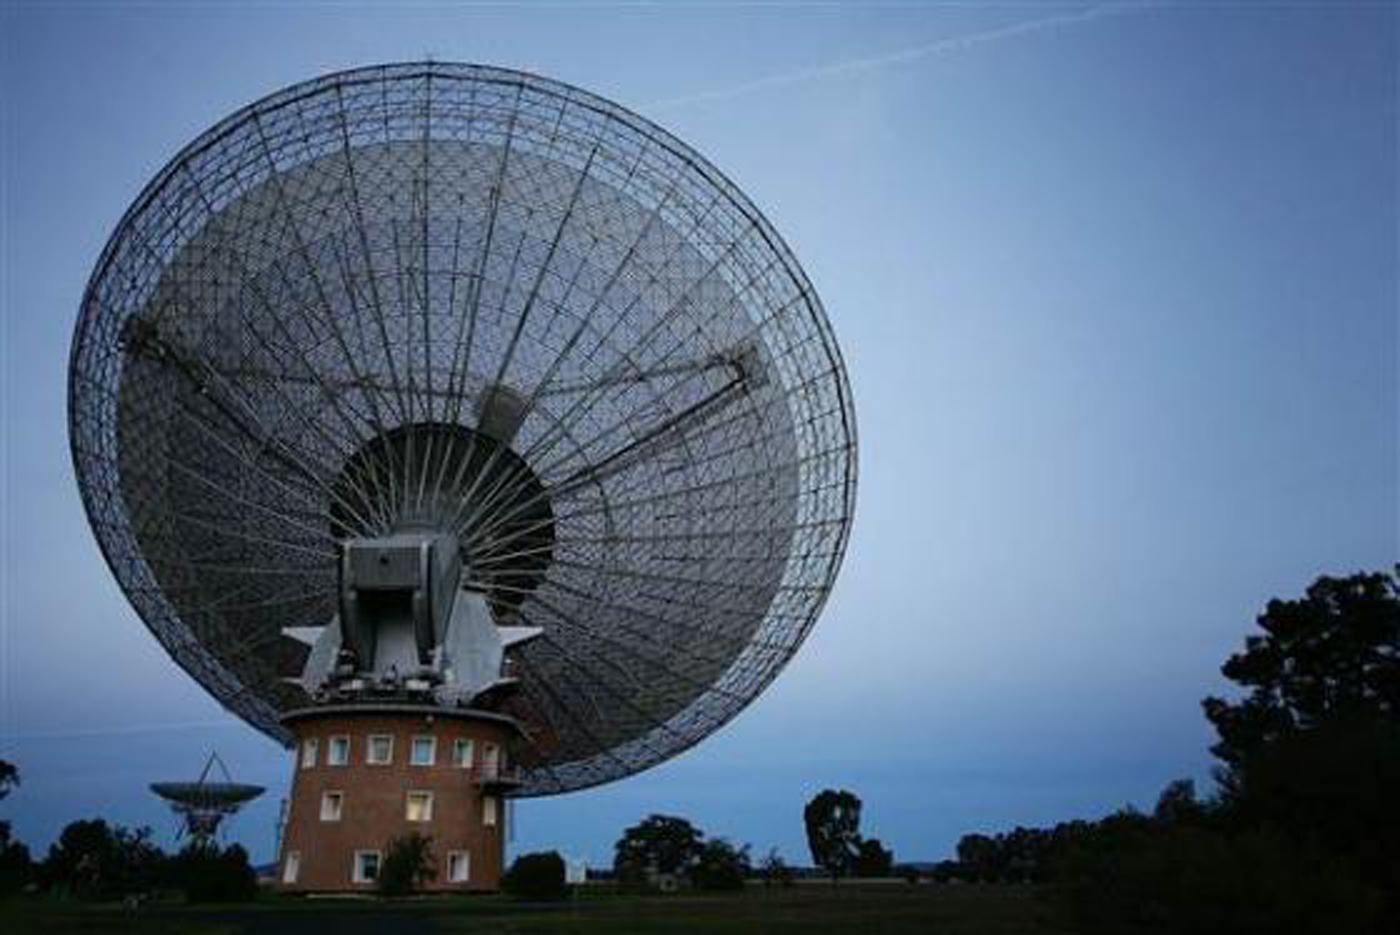
The SETI Institute negotiated with the Commonwealth Scientific and Industrial Research Organization for dedicated use of the telescope during the period from February through early June, 1995. Aside from a few time-critical pulsar experiments, the telescope was used exclusively for SETI observations. Hence, the telescope tower carried the Project Phoenix banner and the Flag of Earth. The flag is a tradition for many SETI programs, symbolizing that the search is conducted on behalf of all people.
The signal processing equipment is contained in the Mobile Research Facility (MRF), a portable facility container, at the base of the telescope tower. Monitor and control of the observations and equipment is conducted from the telescope Control Room in the tower. (The control room is located in the tower behind the row of windows below the flag in the picture.)
The Observing Plan
The goal for Project Phoenix at Parkes was to observe 172 stars over the entire frequency range from 1200 MHz to 3000 MHz. (Although we would like to observe to a lower frequency limit of 1000 MHz, the Mopra receiver could not tune below 1200 MHz.) Each star was observed at each frequency for a period ranging from about 2.5 to 5 minutes.
The Observations
We conducted more than 23,000 observations in 2400 hours of available telescope time. Each "observation" covered a 10 MHz wide portion of the spectrum for a period of either 276 seconds or 138 seconds.
The observations were divided into two frequency ranges:
- L-Band: 1200 MHz - 1745 MHz
- S-Band: 1745 MHz - 3000 MHz
At S-Band, approximately 110 stars were observered over the available frequency range. All 59 stars from the two highest priority groups were observed. Strong interference from a TDRSS satellite blocked observations in the frequency band from 2095 MHz to 2115 MHz for most of the observing period. The upper portion of S-Band was basically clear of interference.
At L-Band, all 209 stars were observed over the available frequency range. Strong interference from a number of satellites blocked frequencies from 1535 MHz to 1635 MHz. Other frequencies received sporadic interference from satellites.
The Follow Up Detection Devices (FUDDS) conducted immediate follow-up tests that ruled out all but a few dozen signals as interference. Those signals were subjected to further tests that showed them to be terrestrial.
Pioneer 10 - Testing the System
The Project Phoenix system is designed to detect faint communication signals coming from light years away while rejecting the cacophany of terrestrial communications. How do we know the system works?
Ideally we'd like a "standard ET signal" for calibrating our sensitivity and checking that all of the electronics and software at both the primary and verification sites are working properly. Unfortunately, until we make the discovery, we don't have such a signal.
Fortunately, we have something that provides a pretty good approximation to an ET signal.
Pioneer 10
The Pioneer 10 spacecraft was launched in 1972. After sending back the first close-up pictures of Jupiter and Saturn, it has continued traveling through and beyond our Solar System. Now at a distance of more than 6 billion miles (10,000 million kilometers), and broadcasting with a power of a few watts (a small flashlight), it provides an excellent test for the Phoenix System.
The Signal from Pioneer 10
Unlike most radio astronomy experiments, Project Phoenix does not compensate for the motion of the Earth during its observations. This means that most ground-based transmitters will appear to have a constant frequency, much like the test signal shown above. Signals from deep space will show a drift in frequency due to the changing relative velocity between the transmitter (perhaps on a spacecraft or another planet) and the radio telescope on the Earth. An example of such a signal, from the Pioneer 10 spacecraft is shown below.
During a subsequent observation, we switched the computer display to show one of the "side bands" where Pioneer 10 transmits data. In the image below, the lower portion of the waterfall plot shows a part (643 Hz) of the spectrum containing the carrier signal. The upper two thirds of the plot shows a different part of the spectrum containing the data signal.